The camunda process engine has a very active codebase and is constantly evolving. Only last week we did a major refactoring, re-implementing the way the BPMN Boundary Event, Event Subprocess, Terminate End Event and similar constructs work. In summer we introduced an activity instance model and rewrote the history implementation, turning it into a fire-and-forget event stream.We also constantly add new features such as incidentsand many others.
When doing such refactorings, the extensive process engine testsuite gives us the confidence that we do not break existing functionality from a functional perspective (process engine currently has 1669Testases, over 500 were added last year). On top of that, we put quite some effort into database migration testing, making sure that you can migrate running process instances from one version of camunda BPM to another. However, one important thing that we did not systematically track until now is process engine performance. We did do intermittent benchmarks whenever we did major changes but until now we did not track performance systematically.
In this post I want to give a short insight into the process engine performance testsuite we are currently setting up and the design goals behind it.
We are currently setting up a performance testsuite in the camunda BPM platform repository. The testsuite is located in the qa/ folder and can be run as part of the maven build. (See project README for details.) We are still at the beginning of this effort but I wanted to share some insights early on.
Goals of the Performance Testsuite
The performance test suite will serve three main goals:
- Systematically tracking the evolution of the process engine performance over time,
- Serving as a tool for process engine optimization,
- Producing results for different process engine features and configurations.
Tracking performance over time is important due to the refactorings we do in the process engine codebase and the new features we constantly add. When adding a feature or when changing an existing feature, we want to see how this change impacts performance. Does the change make the process engine slower? The testsuite shall also serve as a tool for optimization. The main source for optimizations in the process engine is looking at the database communication profile. Database communication constitutes the main bottleneck when it comes to process engine performance. If you can optimize database communication, the process engine will be faster. This is why the performance testsuite also provides the possibility to perform Database Sql Statement logging, counting the INSERTs, DELETEs, SELECTs and UPDATEs, performed by a test run. Finally, we want to produce results for different features and configurations of the process engine. We want to provide answers to questions like “How does turning on history logging impact performance?”, “What’s the cost of a process variable?”, “How do different BPMN constructs behave?”. We can also run the testsuite against different databases and gain insight into the differences of these databases when used as persistence provider for the process engine.
Benchmarks
The benchmark runs the performance testsuite in multiple passes. Each pass will perform a configurable number of iterations on a certain number of threads. The first pass will use one thread, the second one two threads, the third one three threads and so forth. The benchmark gives some relative numbers as to how long it takes to run a certain process in a number of iterations with a given amount of threads. It will also show to which extent adding more threads will influence the performance numbers (scale up).
The Sql Statement Log
The Sql Statement Log allows gaining insight into the process engine’s communication profile with the database, counting the INSERTs, UPDATEs, DELETEs and SELECTs performed by a testrun. This is interesting since the database communication is the main source of performance bottlenecks. It also provides the most potential for optimizations.
Output of a Performance Test
A performance test will produce a list of JSON files in the target/results/ folder of a project. The JSON files contain detailed data about the performance test. The following is the output of an individual SQL statement log for a process consisting solely of a message start event:
{
 "testName" : "StartEventPerformanceTest.messageStartEvent",
 "configuration" : {
  "numberOfThreads" : 1,
  "numberOfRuns" : 1,
  "testWatchers" : "org.camunda.bpm.qa.performance.engine.sqlstatementlog.StatementLogPerfTestWatcher
 },
 "passResults" : [ {
  "duration" : 8,
  "numberOfThreads" : 1,
  "stepResults" : [ {
   "stepName" : "StartProcessInstanceByMessageStep",
   "resultData" : [ {
    "statementType" : "SELECT_MAP",
    "statement" : "selectMessageStartEventSubscriptionByName",
    "durationMs" : 1
   }, {
    "statementType" : "SELECT_MAP",
    "statement" : "selectProcessDefinitionById",
    "durationMs" : 1
   }, {
    "statementType" : "INSERT",
    "statement" : "insertHistoricProcessInstanceEvent",
    "durationMs" : 1
   }, {
    "statementType" : "INSERT",
    "statement" : "insertHistoricActivityInstanceEvent",
    "durationMs" : 1
   } ]
  } ]
 } ]
}
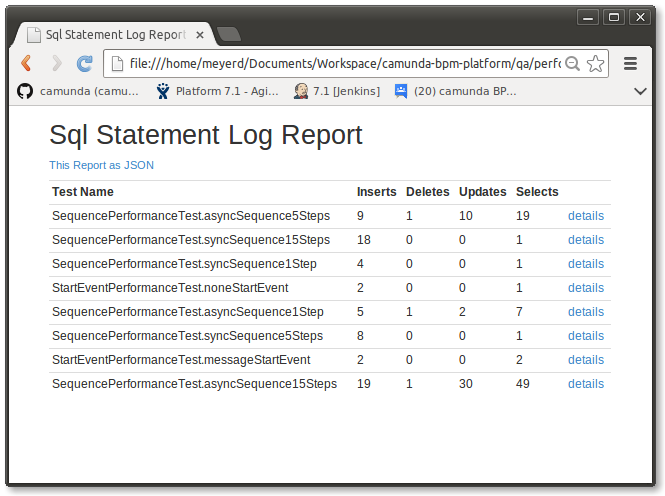
Aggregating the Results
The performance test suite then allows to aggregate the results of all individual test runs into an aggregated report which is rendered in both HTML and JSON format: