
We’re excited to announce the release of Camunda Optimize 3.0.
Camunda Optimize provides business activity monitoring for workflows, supporting continuous process improvement by providing transparency into your automated workflows and decisions. Business-friendly reports, dashboards, and alerts make it possible to identify process bottlenecks and improve end-to-end processes.
And Optimize 3.0 is a significant milestone for the product: for the first time, it’s possible to import process data into Optimize from a range of external sources and carry out monitoring, reporting, and continuous improvement for end-to-end processes even in cases where the entire process isn’t yet automated by Camunda BPM.
“Camunda Optimize provides real-time visibility into our process automation cases, including third-party events from Robotic Process Automation (RPA)”
said Eduardo Conceição, RPA Architect at Nokia.“This allows us the opportunity for a complete, end-to-end view of an entire business process in an easier way – no matter what technology. As a result, we could better identify bottlenecks, analyze process performance and ultimately improve our processes overall.”
If you’d like to learn more about the release and ask our product team questions, we invite you to join us for the Optimize 3.0 webinar on Wednesday, April 8, 2020.
To get started with Optimize 3.0 right away, you can download a 30-day Camunda Enterprise Edition trial.
Existing Camunda customers can download Optimize 3.0 using their enterprise credentials. You can also view the full release notes.
In the rest of this post, we’ll cover Process Events Monitoring and other new capabilities of Optimize 3.0 in more detail.
Process Events Monitoring: Any Data Source, True End-to-End Process Visibility
Over the past couple of years, we’ve heard firsthand reports from customers about the impact that Optimize can make visible what was once invisible. In doing so, Optimize enables employees to focus their process improvement efforts where they can be the most effective.
But we’ve also learned that only providing visibility into processes that are being automated by Camunda BPM isn’t enough. In some cases, a Camunda-automated process represents only a subset of the organization’s entire end-to-end process.
There are many reasons this might be the case. Maybe some steps in the end-to-end process are executed by microservices that are built and managed by teams that haven’t yet started working with Camunda. Or maybe the process relies on a legacy system that’s impossible to integrate with the Camuna Engine, even with Camunda’s flexible REST API.
Whatever the reason that the entire end-to-end process isn’t yet automated by Camunda, the need is the same: to get near real-time visibility from the end-to-end process into Optimize even if it means importing and analyzing process data from external (non-Camunda) sources. This broader process visibility is essential for getting a high-level overview of your business process, investigating anomalies, ensuring SLAs are met, and fixing problems quickly. And that’s exactly what Process Events Monitoring provides.
Optimize 3.0 includes a new REST API for event ingestion based on the CloudEvents specification, making it possible to import process-related events from any external system and independent from your technical architecture.

Once Events have been ingested they can be mapped to a BPMN 2.0 process model directly in Optimize. The process model can consist of external events, but also events from processes that are already being executed in a Camunda engine.
You can simply model a process directly in Optimize and map any Camunda Process Events as well as external events to this process.

Finally this allows you to monitor true end-to-end processes in near real-time by using Optimize powerful reports and dashboards.
In the following example, the detailed Customer Onboarding process (on the right) has been automated in the Camunda Engine and the Process on the left is a high-level end-to-end process that also makes use of external events from a legacy Input Management system that is not yet orchestrated by the Camunda engine.
The end-to-end process not only allows to monitor durations for the entire process but also allows to easily identify process alternatives – as e.g. digital vs. manual applications. Without this end-to-end view this information would get lost and process improvement would only be possible for parts of the process.

Creating A Custom View Into Your Processes
Another key scenario supported by Process Events Monitoring is creating custom views of processes that are being automated by Camunda BPM, such as only including a few key “milestone” flow nodes from a process that are relevant to a certain group of stakeholders.
Let’s look more closely at a common example: creating business-friendly views and reports for complex processes that are automated by Camunda BPM.
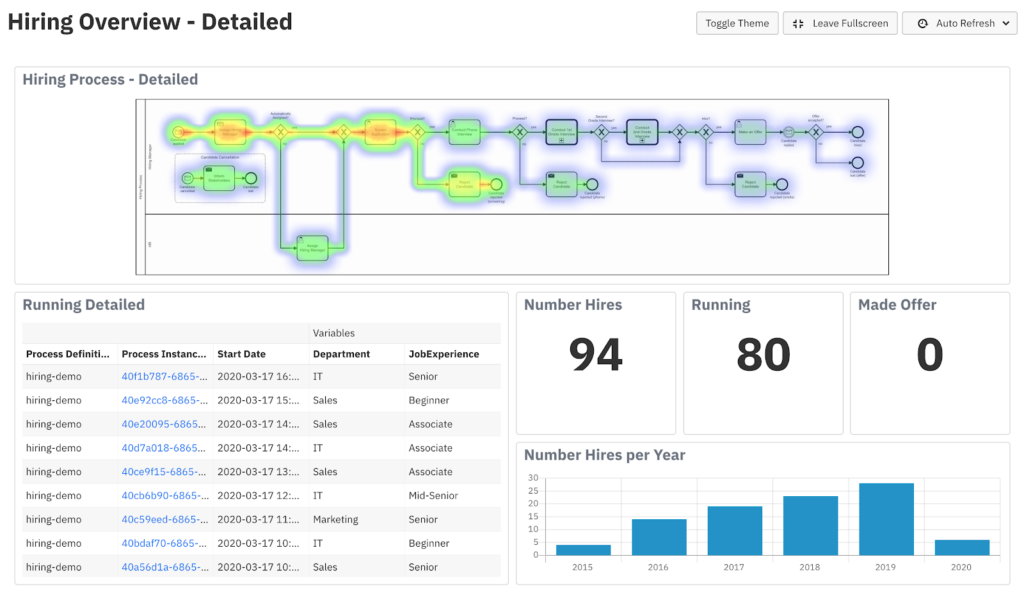
Imagine a case where the following process model is automated by Camunda BPM. One team needs to monitor and analyze this model in its entirety. They created this dashboard:

But this complex process could be distilled into a simpler process model view for business users based on key milestones. Certain users are only interested in high-level milestones such as Candidate Applied, Rejected Applications or Applications where an offer was made.

This business-friendly process can be analyzed and included in dashboards in Optimize the same as any process that’s automated by Camunda BPM:

Getting Started with Event Monitoring
There are a number of different use-cases for Process Events Monitoring that have not been covered in detail in this blogpost. Simply try it out on your own and get started with Event Monitoring today:
We have made available a detailed User Guide that explains everything you need to know step-by-step: Event Monitoring User Guide
Our consulting team also published a small example for a simple setup of Optimize including Camunda Runtime Platform with Docker-Compose:
GitHub Example
Improved Reporting, Dashboarding and Alerting
We have not only been working on End-to-End Visibility, but Optimize 3.0 includes many improvements for our reporting and monitoring capabilities that allow for more fine-grained analysis and simplify report and dashboard creation.
Enhanced Date Filters
With this release, we added more capabilities to our date filters and also improved the usability of the existing functionality.
Prior to 3.0, there were two different approaches for filtering on dates. You could either filter on a fixed date period, or you could look at a relative time period from today in the past.
One piece of functionality that was missing was the selection of instances that were started or ended in a certain period of time – but relative to the evaluation date of the report itself.
We have added this functionality by reworking the Date Filter for Start and End Date of Process Instances completely.
The new capabilities are shown in the following screenshot and in more detail below.

Fixed Period
Example: Show me all process instances that have been started between January, 17 and January, 24 2020.

Rolling Period
Example: Show me all process instances that have been started in the last 2 days.

New Relative Period
Example: Show me all process instances that have been started last month.

Enhanced User Task Monitoring and Reporting
Optimize 3.0 includes further enhancements to the User Task Monitoring and Reporting capabilities.
Group by Start or End Date of User Tasks and Distribute by User Task
With this release we add the possibility of grouping user task counts and durations by their respective start and end dates. This functionality allows users to use Optimize efficiently for trend analysis since it is now possible to see how the number of user tasks, or duration of user tasks, changes depending on their respective start or end date.
This information is available summarized for all User Tasks of a Process or distributed by User Tasks separately:

Group by UserTask Distributed by Assignee
Up to this point when monitoring the distribution of User Tasks across Assignees or Candidate Groups, it was only possible to see the number or duration of each User Task per Assignee or Candidate Group:

This release adds the possibility to group by User Task and distribute by Assignee or Candidate Group. The resulting report could look like this:

This report can help to get a good overview about the distribution of each User Task across different Assignees or Candidate Groups.
Unassigned User Tasks
The number of unassigned User Tasks and their duration can be very useful when monitoring or analyzing User Task Performance since you can identify the User Tasks no one works on.
Therefore, we have added Unassigned User Tasks to all relevant reports by default. There is no additional work needed from your side to access this data.
The following example shows all User Tasks of a Process grouped by assignees:

Additionally, it is also possible to look at the same information distributed by specific User Tasks. This makes it possible to easily identify how many User Tasks are unassigned currently.

Dashboarding
With Optimize 3.0 we have completely reworked the dashboard edit mode: When adding a report to a dashboard other reports now automatically make space for the report. Especially in dashboards that contain many reports this improvement simplifies dashboard interactions a lot.
Alerting
With Optimize you can get alerted when critical process KPIs are met – e.g. because your process is performing slower than expected or you have a drop or increase of instances that need to be handled.
With Optimize 3.0 we make the alerting capabilities more flexible and allow users to get alerted on any external system of their choice by adding support for webhooks.
In order to get alerted on any external system, a webhook needs to be configured in Optimize’s configuration file “environment-config.yaml”. You can find the details in our documentation and an example for Slack here.
Once a Webhook has been configured in the configuration, users can easily select the external System when creating an Alert – even additionally to E-Mail:

Support for Elasticsearch 7
With this release, we are adding official support for Elasticsearch 7 – more precisely 7.0.x, 7.1.x, 7.2.x, 7.3.x, 7.4.x, 7.5.x, and 7.6.x. And we are no longer supporting Elasticsearch 6. If you are currently running Optimize in production, it is possible to easily upgrade from Elasticsearch 6 to Elasticsearch 7.
How to get it
If you want to give Camunda Optimize 3.0 a try, you can download the release here with your Enterprise customer credentials. Please sign up for a free 30-day trial version.
If you’re new to Optimize, we recommend that you watch the Getting Started with Optimize in less than 5 Minutes video.